1.7.7 Delays into Racket, and a density plot
(require plot) (define xs (for/list ([x (table-column grouped-data 'dep_delay)]) x)) (plot (density xs) #:x-label "Departure delay" #:y-label "Density" #:out-file "/tmp/plot.png")
The post’s xs is grouped-data’s dep_delay column, which group-count has replaced by each destination’s count; here xs is the delays themselves. series->list copies a column into a list in one foreign call (the full file’s 328,521 delays take about 3 ms), after drop-nulls removes the cancelled flights, which have no delay:
> (define xs (~> flights (ref "dep_delay") drop-nulls series->list)) > (length xs) 5292
> (require plot/pict)
> (plot (density xs) #:x-max 180 #:x-label "Departure delay (minutes)" #:y-label "Density")
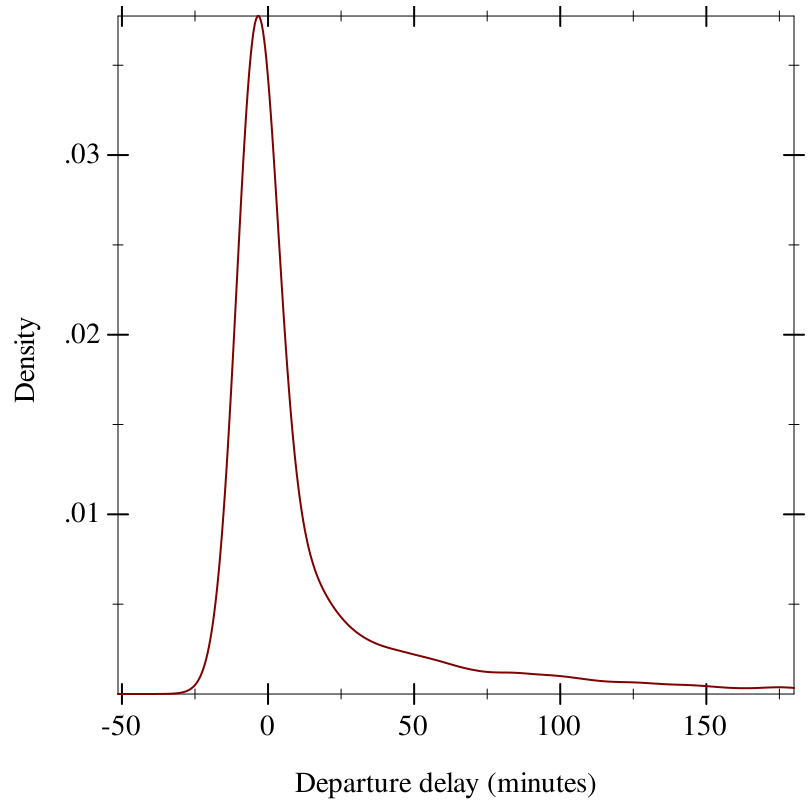
The view stops at three hours; the sample’s longest delay is 853 minutes. Plotting is client code, and a df.plot namespace is a non-goal (#121, Data for a plot): take the columns out with series->list or series->vector and hand them to plot. An f64vector from series->f64vector is not a sequence, so a renderer such as density refuses it; f64vector->list converts it. The plot is drawn while the manual builds, so plot-lib, plot-gui-lib and plot-doc are among the package’s build-deps, which a source install pulls in and a binary package drops. They are not in its deps: (require polars) loads no plotting code.