1.6.5 Data for a plot
Upstream’s Visualization page hands two iris columns to a plotting library. The plot library’s points renderer takes a list of vectors, which is two conversions away.
> (define iris (read-csv iris-csv))
> (define sepals (map vector (~> iris (ref "sepal_width") series->list) (~> iris (ref "sepal_length") series->list))) > (length sepals) 15
> (for/list ([p sepals] [_ 3]) p) '(#(3.5 5.1) #(3.0 4.9) #(3.2 4.7))
> (require plot/pict) > (plot (points sepals) #:x-label "sepal_width" #:y-label "sepal_length")
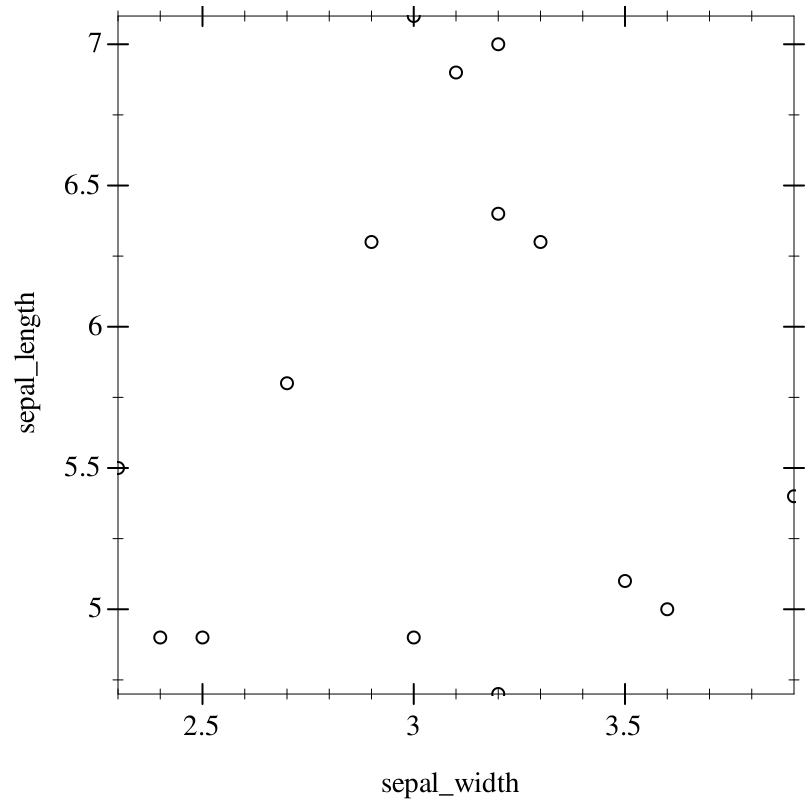
Plotting is a non-goal: rkt-polars will not bind a df.plot namespace or ship a plotting adapter (#121). plot takes the lists and vectors that series->list and series->vector return, so the step df.plot hides is client code here, as above; Case study: nycflights plots a density the same way. An f64vector is not a sequence: pass a series->f64vector result through f64vector->list first.